WEEK 8
TABLE-SETUP
I remember standing in front of the carnivore section, where the tiger’s den was empty. The only thing around the cage was a wallpaper of artificial trees, and some dead plants scattered around the ground. Insects could be heard in the background, and I thought I might have heard the sound of a bear, but I saw none."
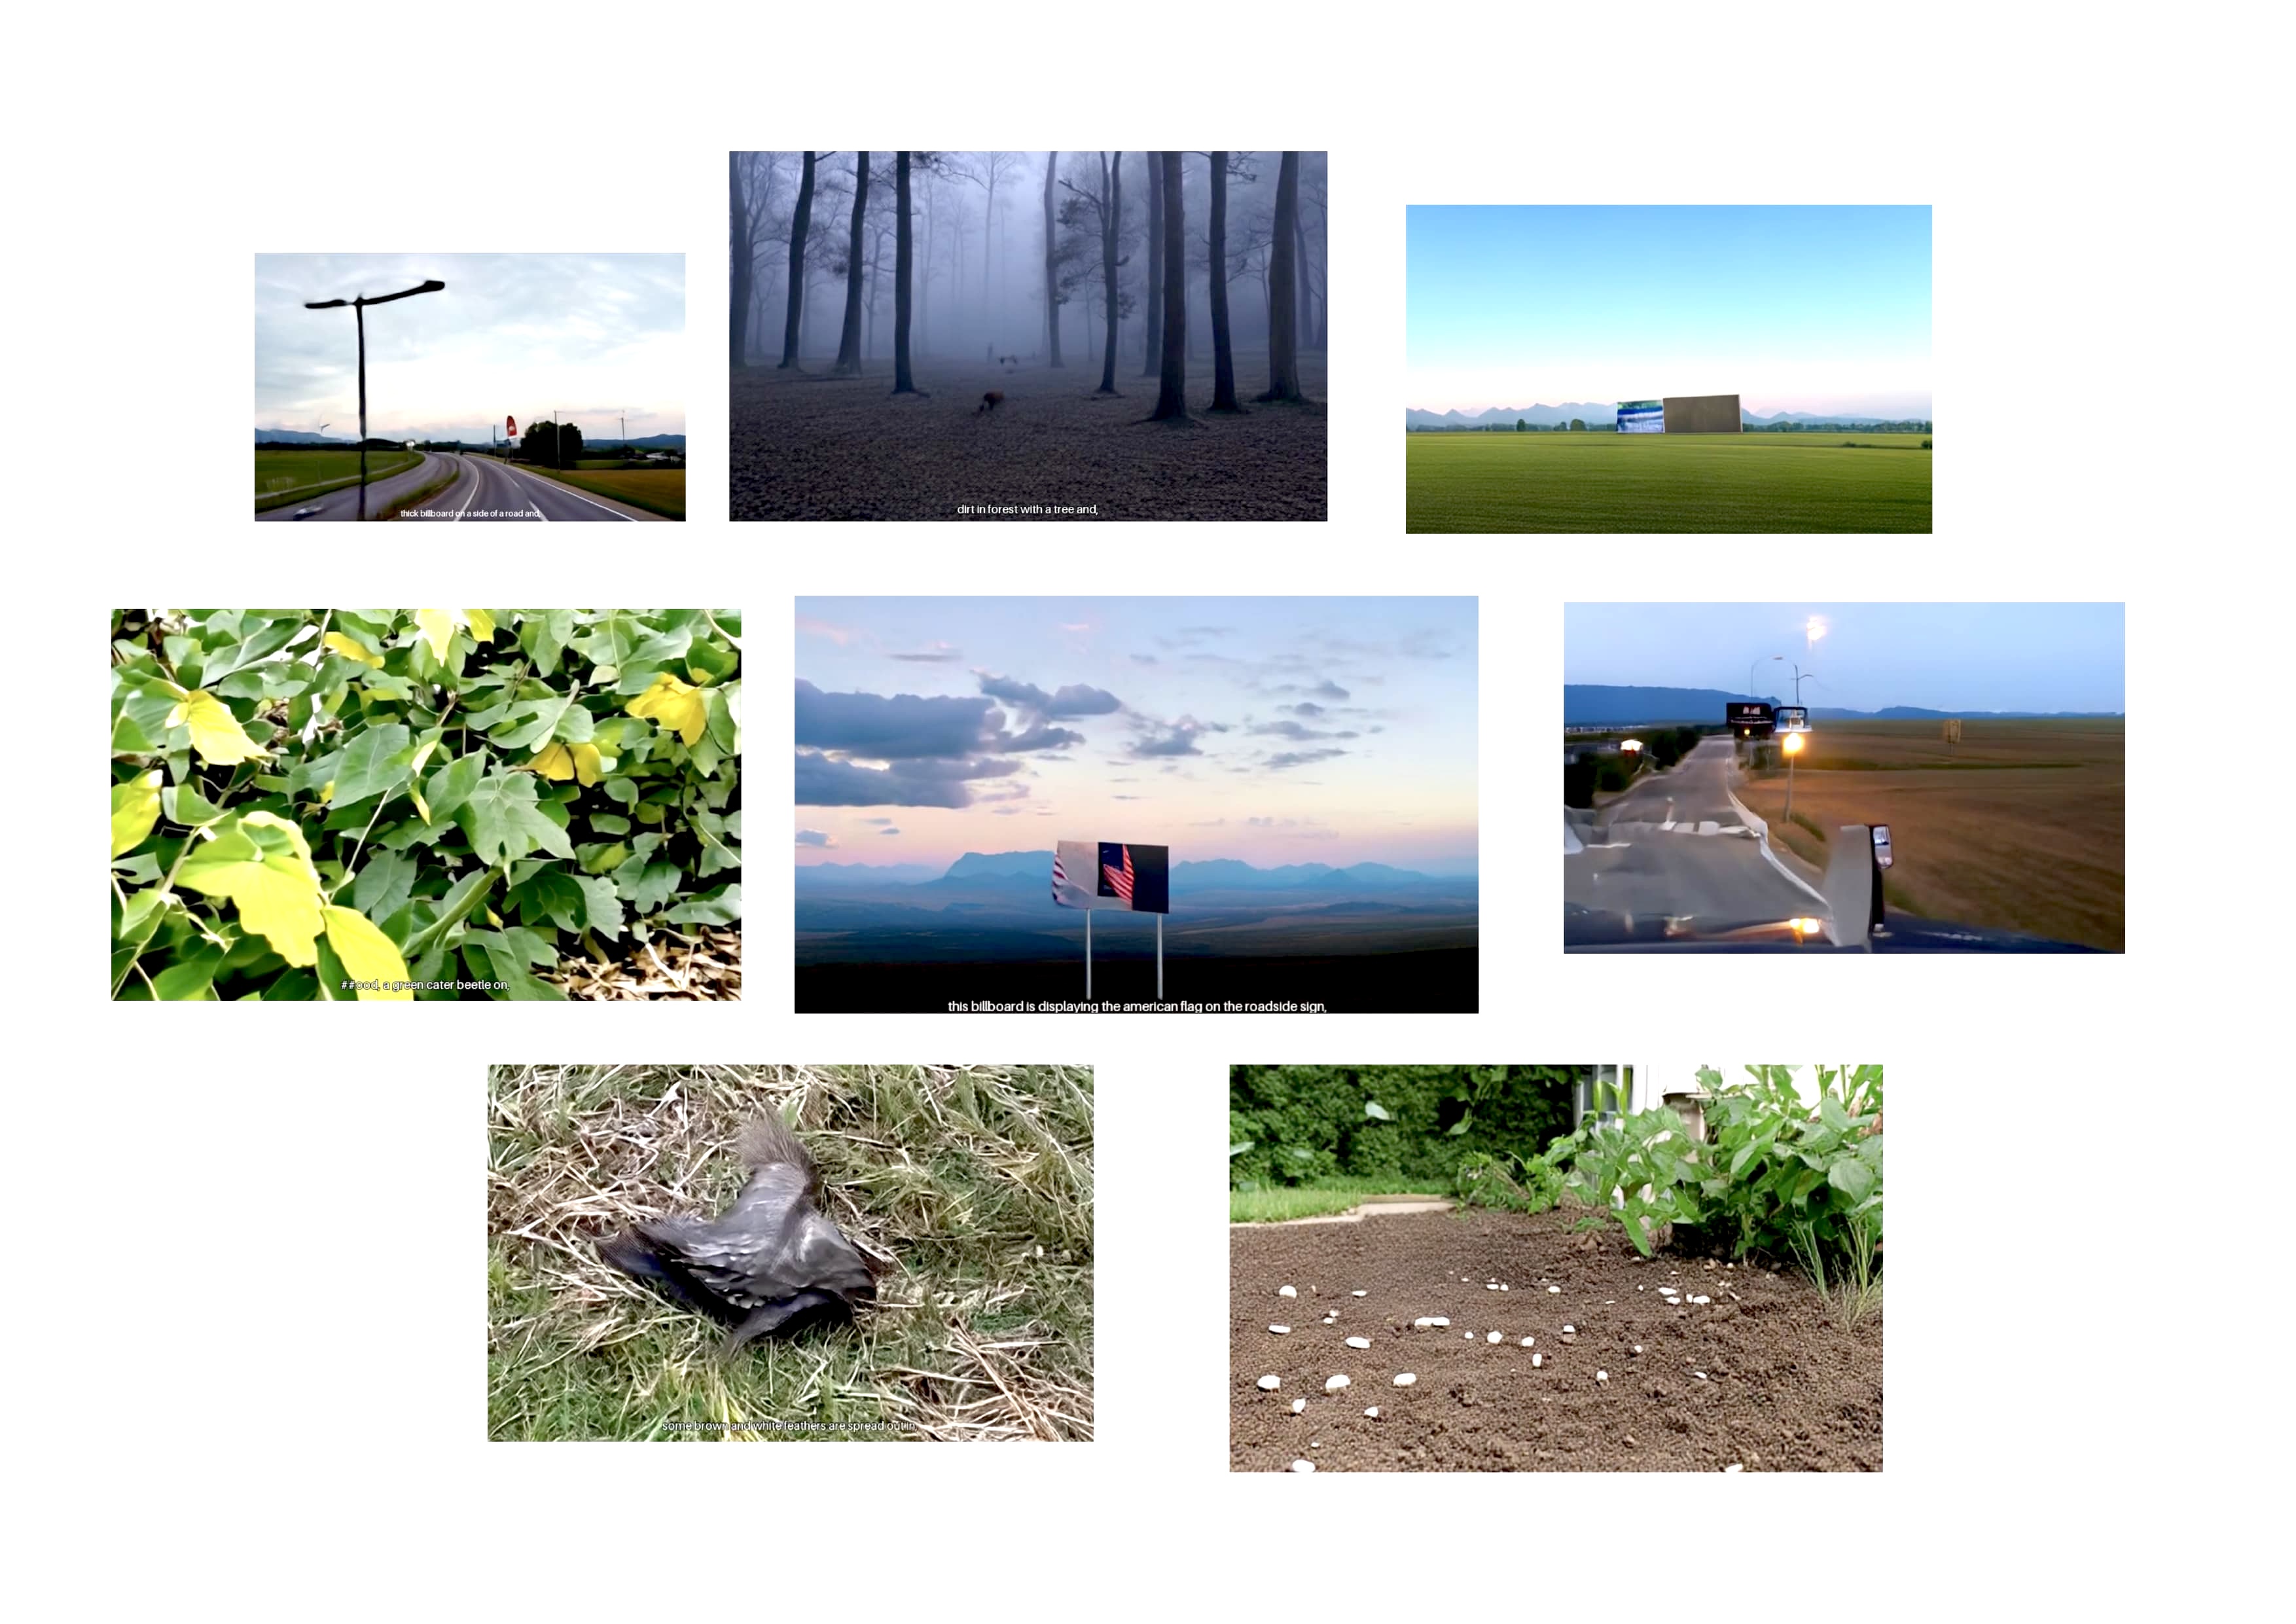
Grid Layout visual outputs of the prompt
Table In-Progress
Content:
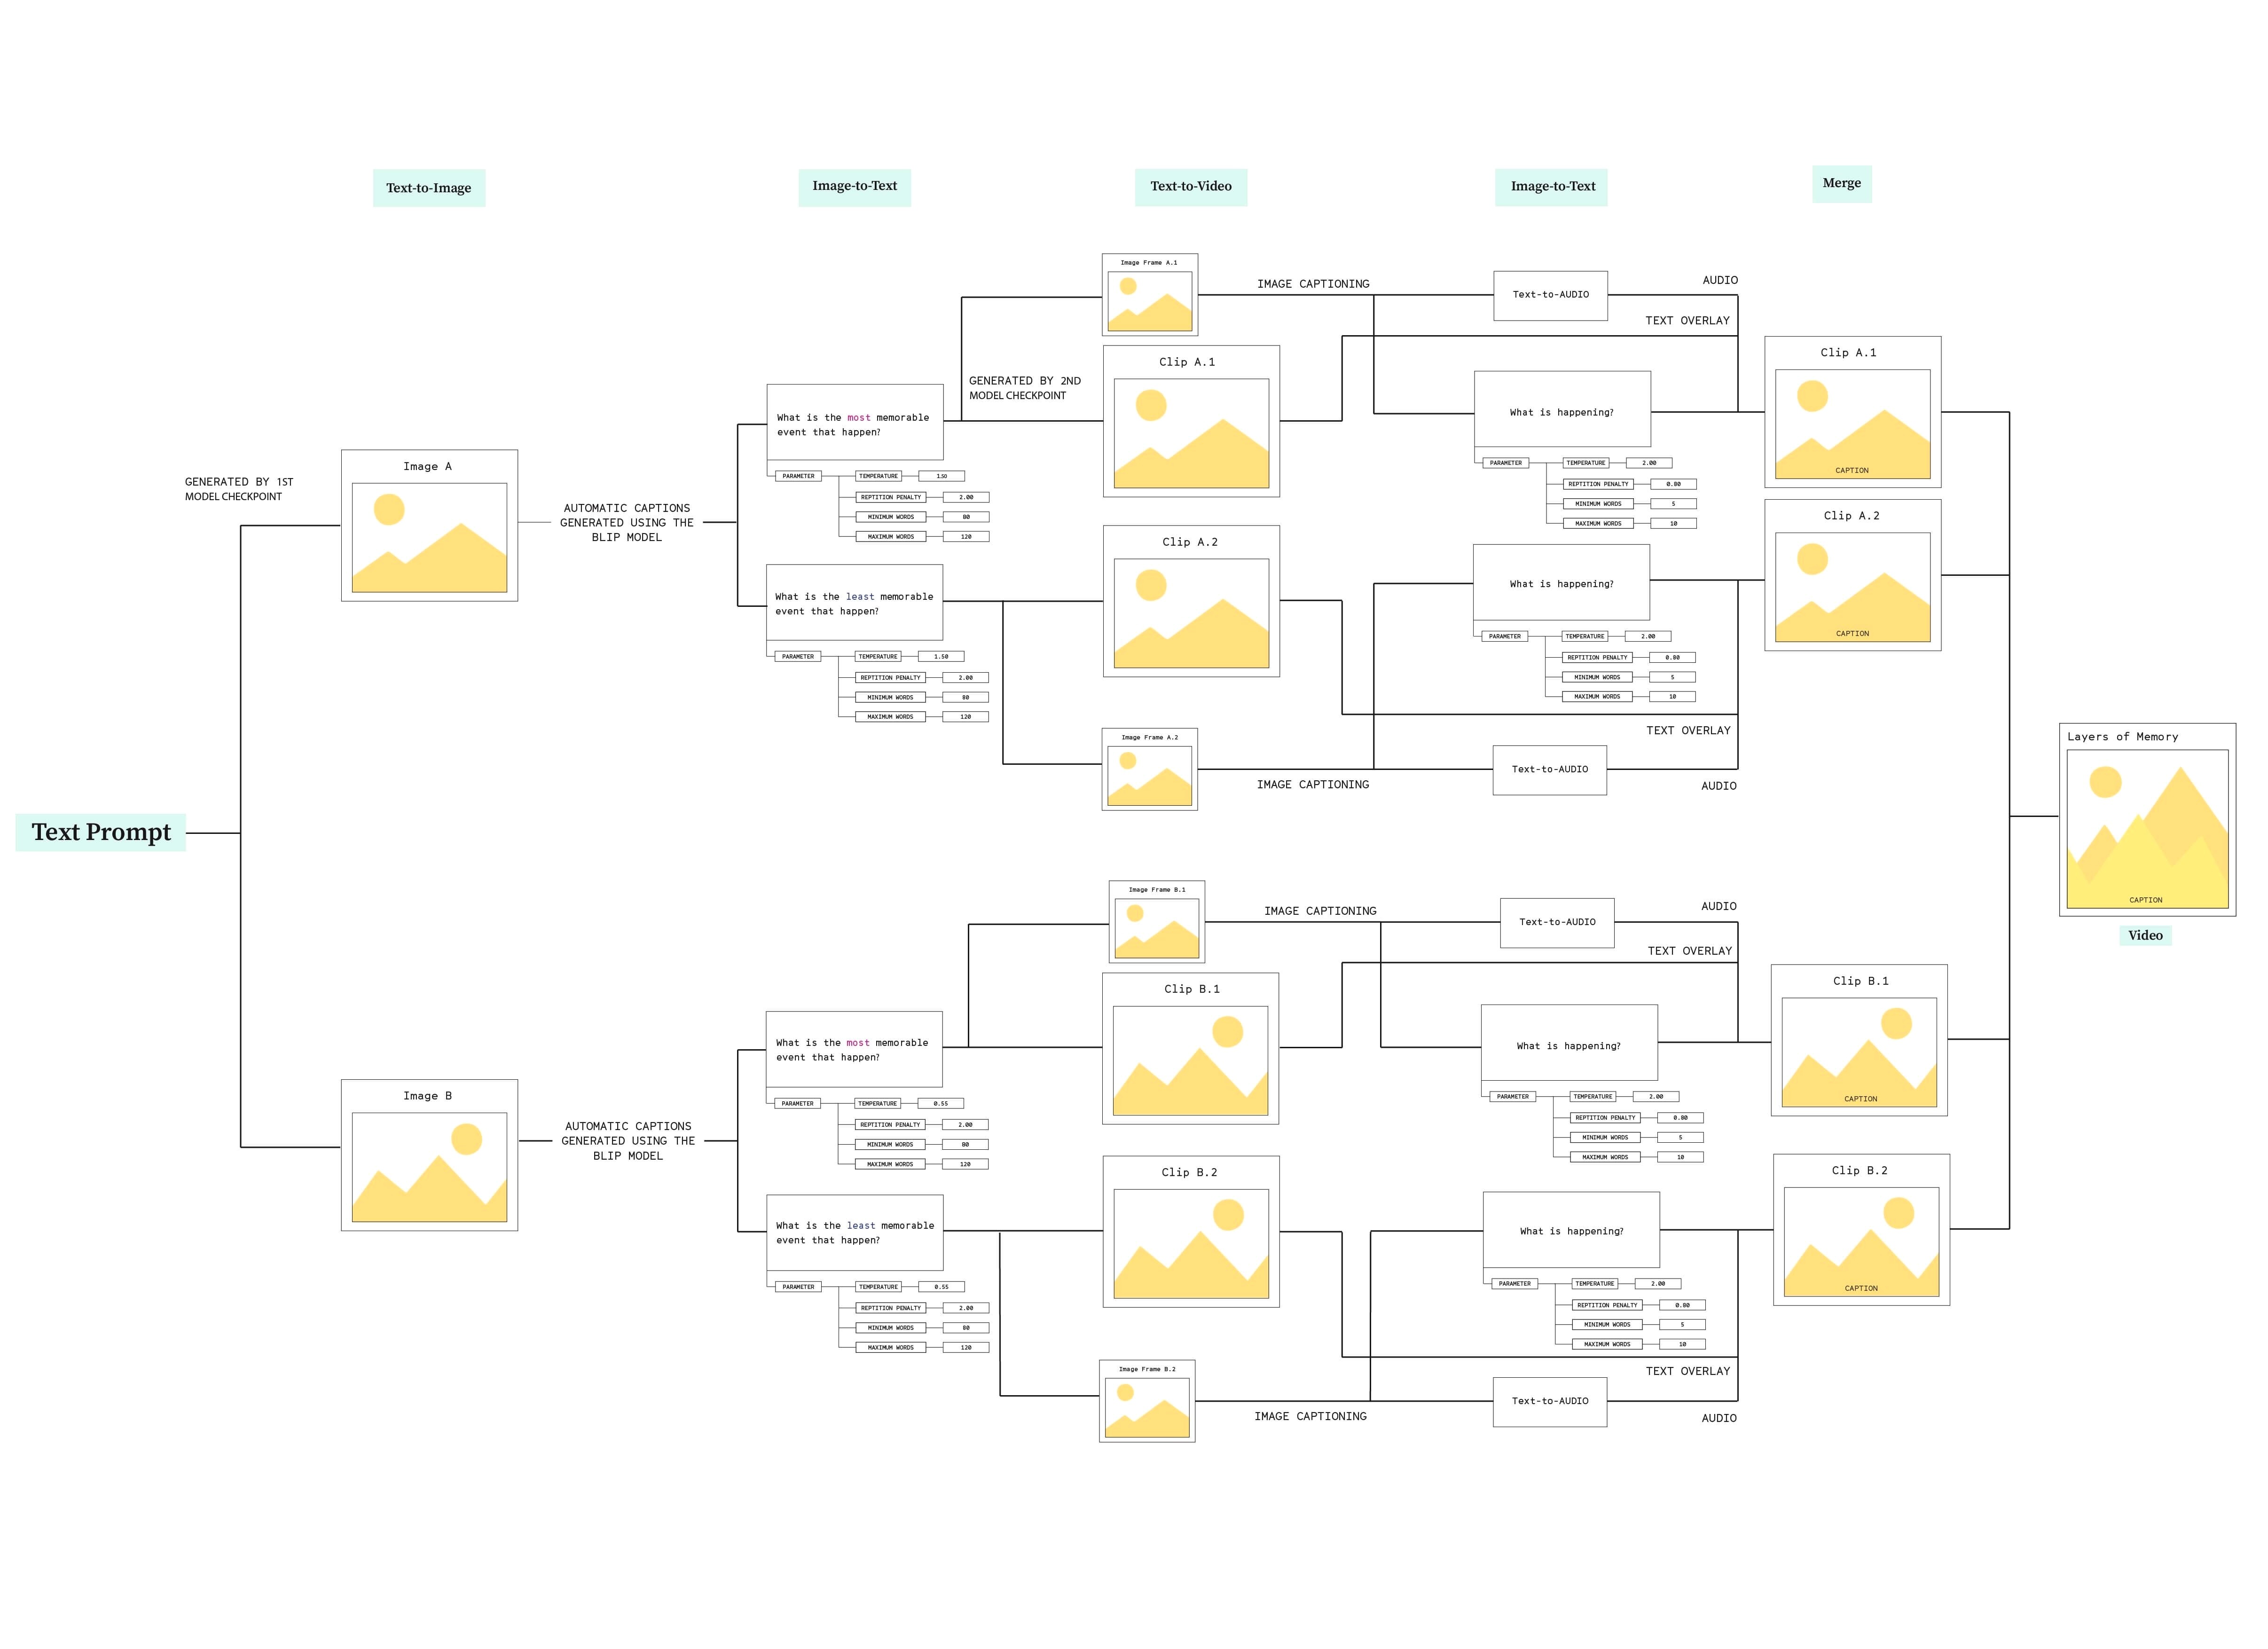
1. Workflow Diagram
2. Selected Outcomes
This week’s focus was to share our progress with table set-ups to our peers. I actually didn’t have a concrete plan yet on how am I going to set up my tables for the Open Studio. However, one thing I am sure of is that I wanted to turn my space into a mini installation where users can interact by putting their own inputs into my workflows and generate outcomes in live-time.
An idea of how am I going to do this is to prepare an input and output interface (Backhand and Frontend System) for the installation. Due to the time constraint, I couldn’t get the live-time to work yet for this week’s sharing. Therefore, I decided to print out my workflow diagram to give out a visual representation of how I designed my own generative structure (added some detailed technical terms), and displayed it on the table.
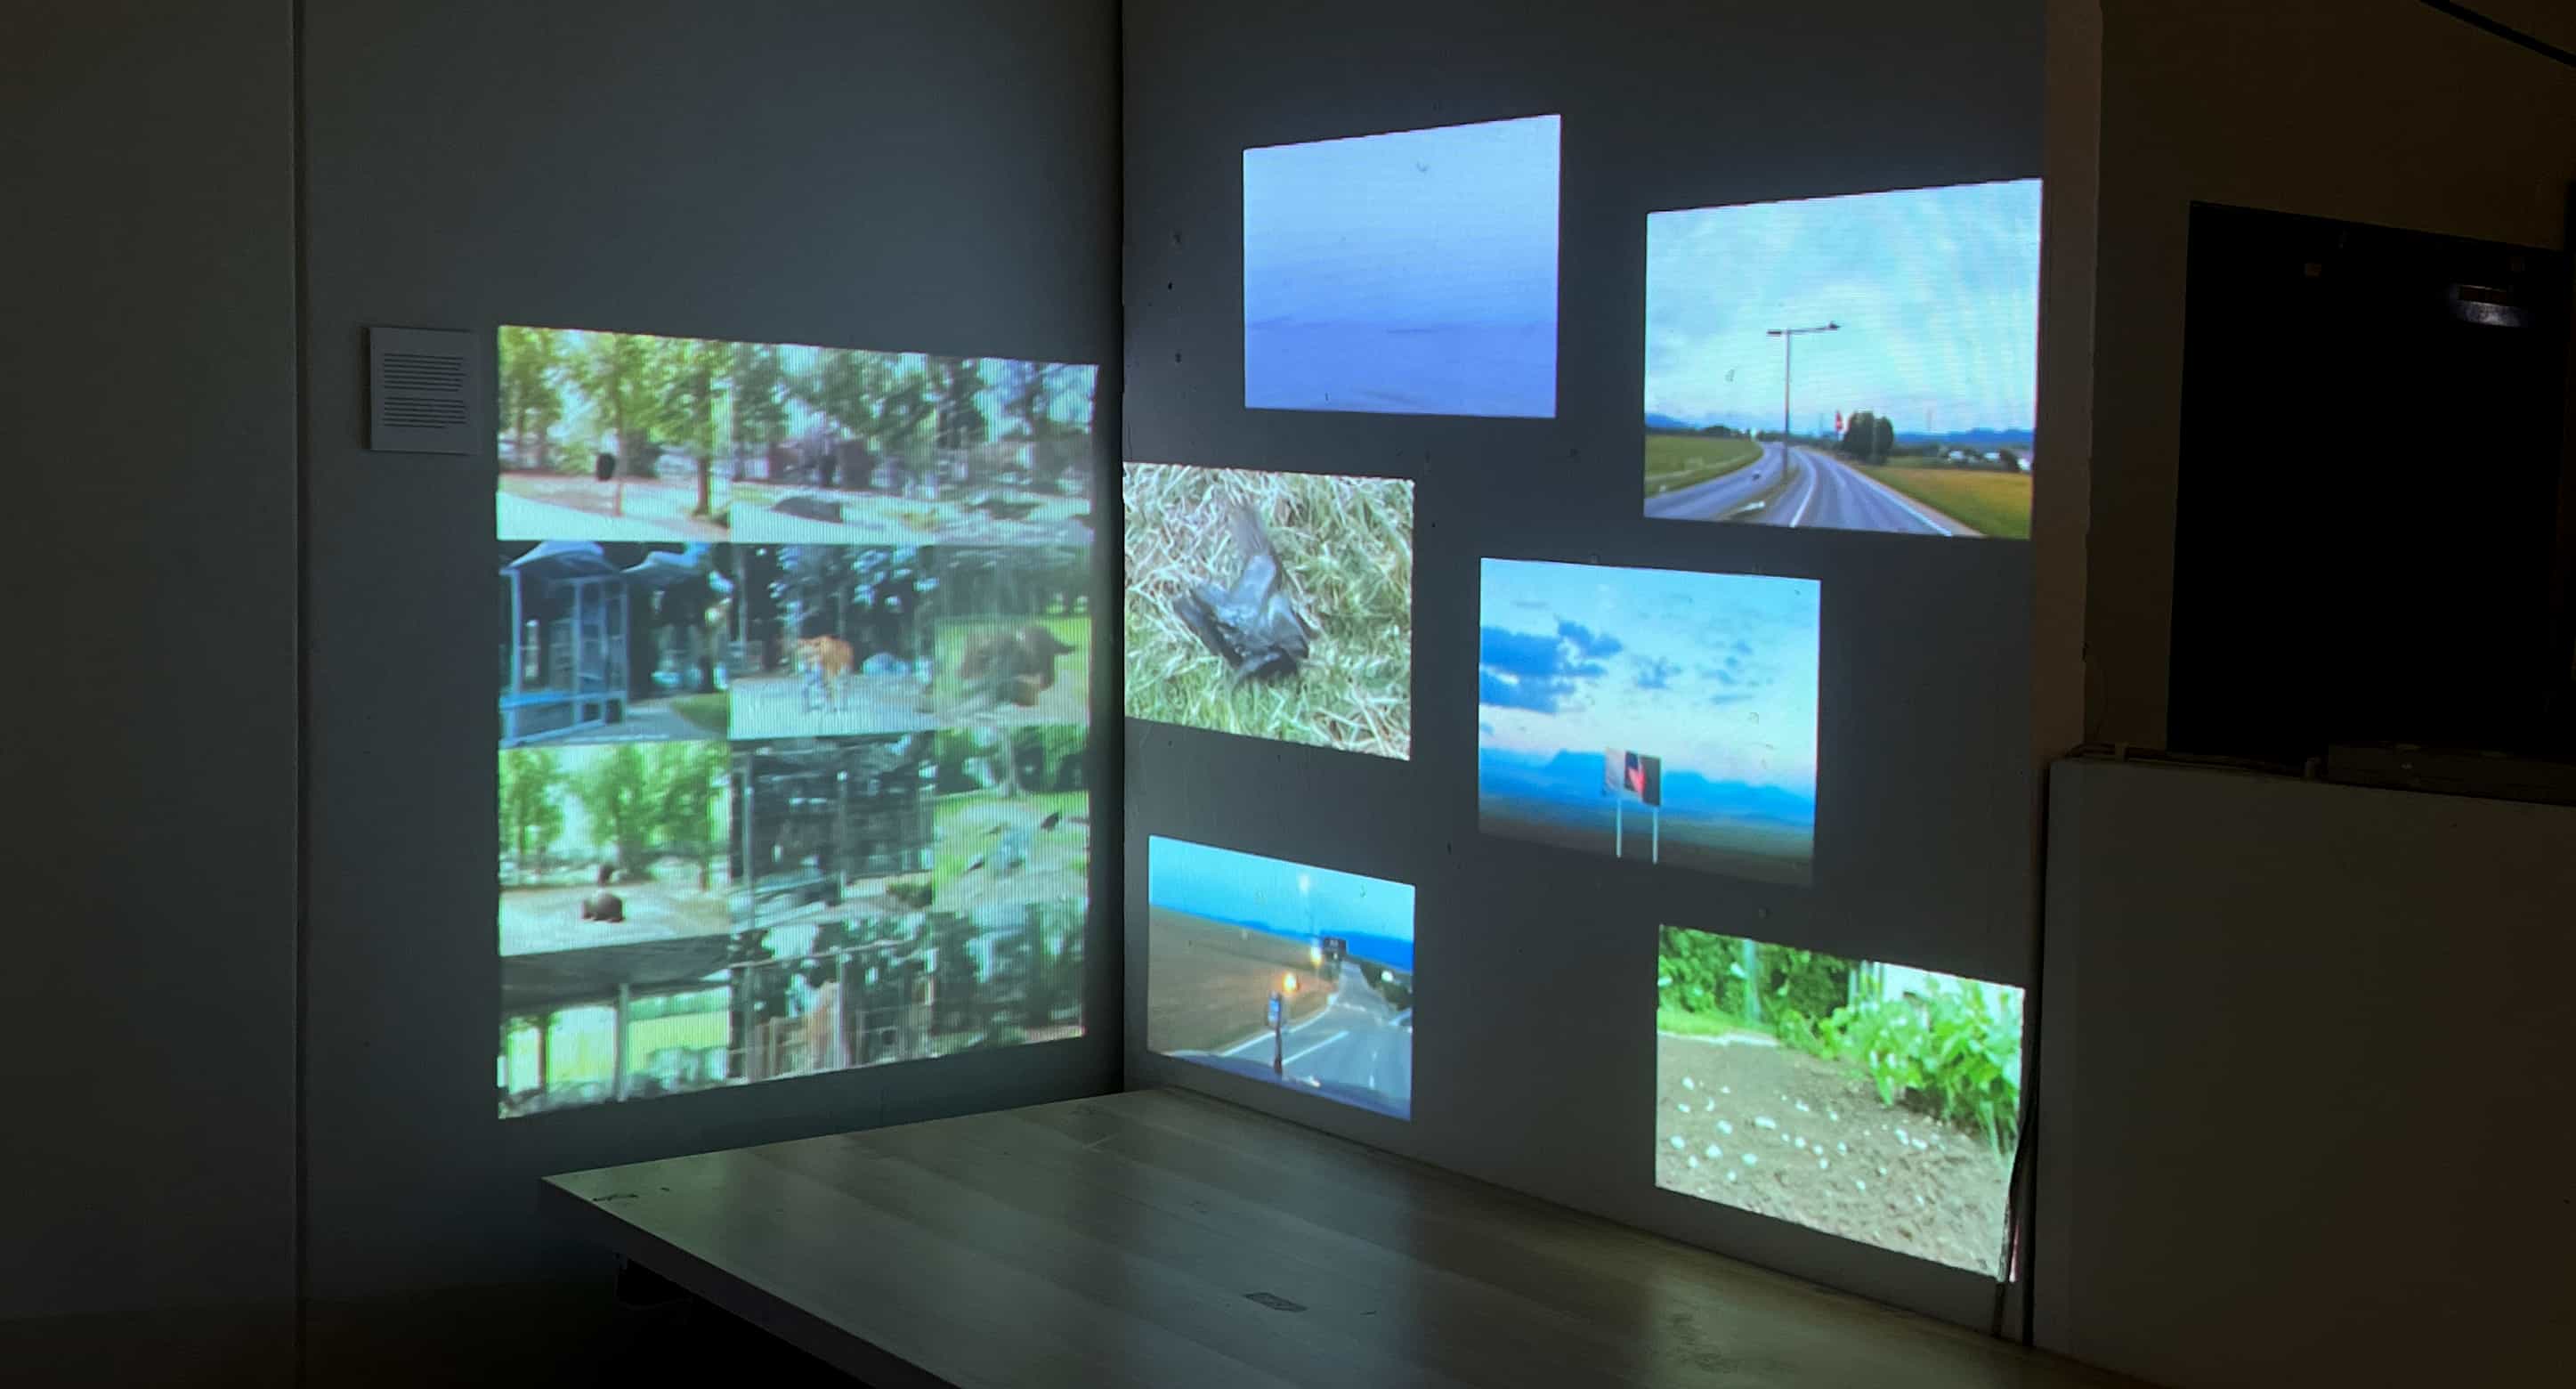
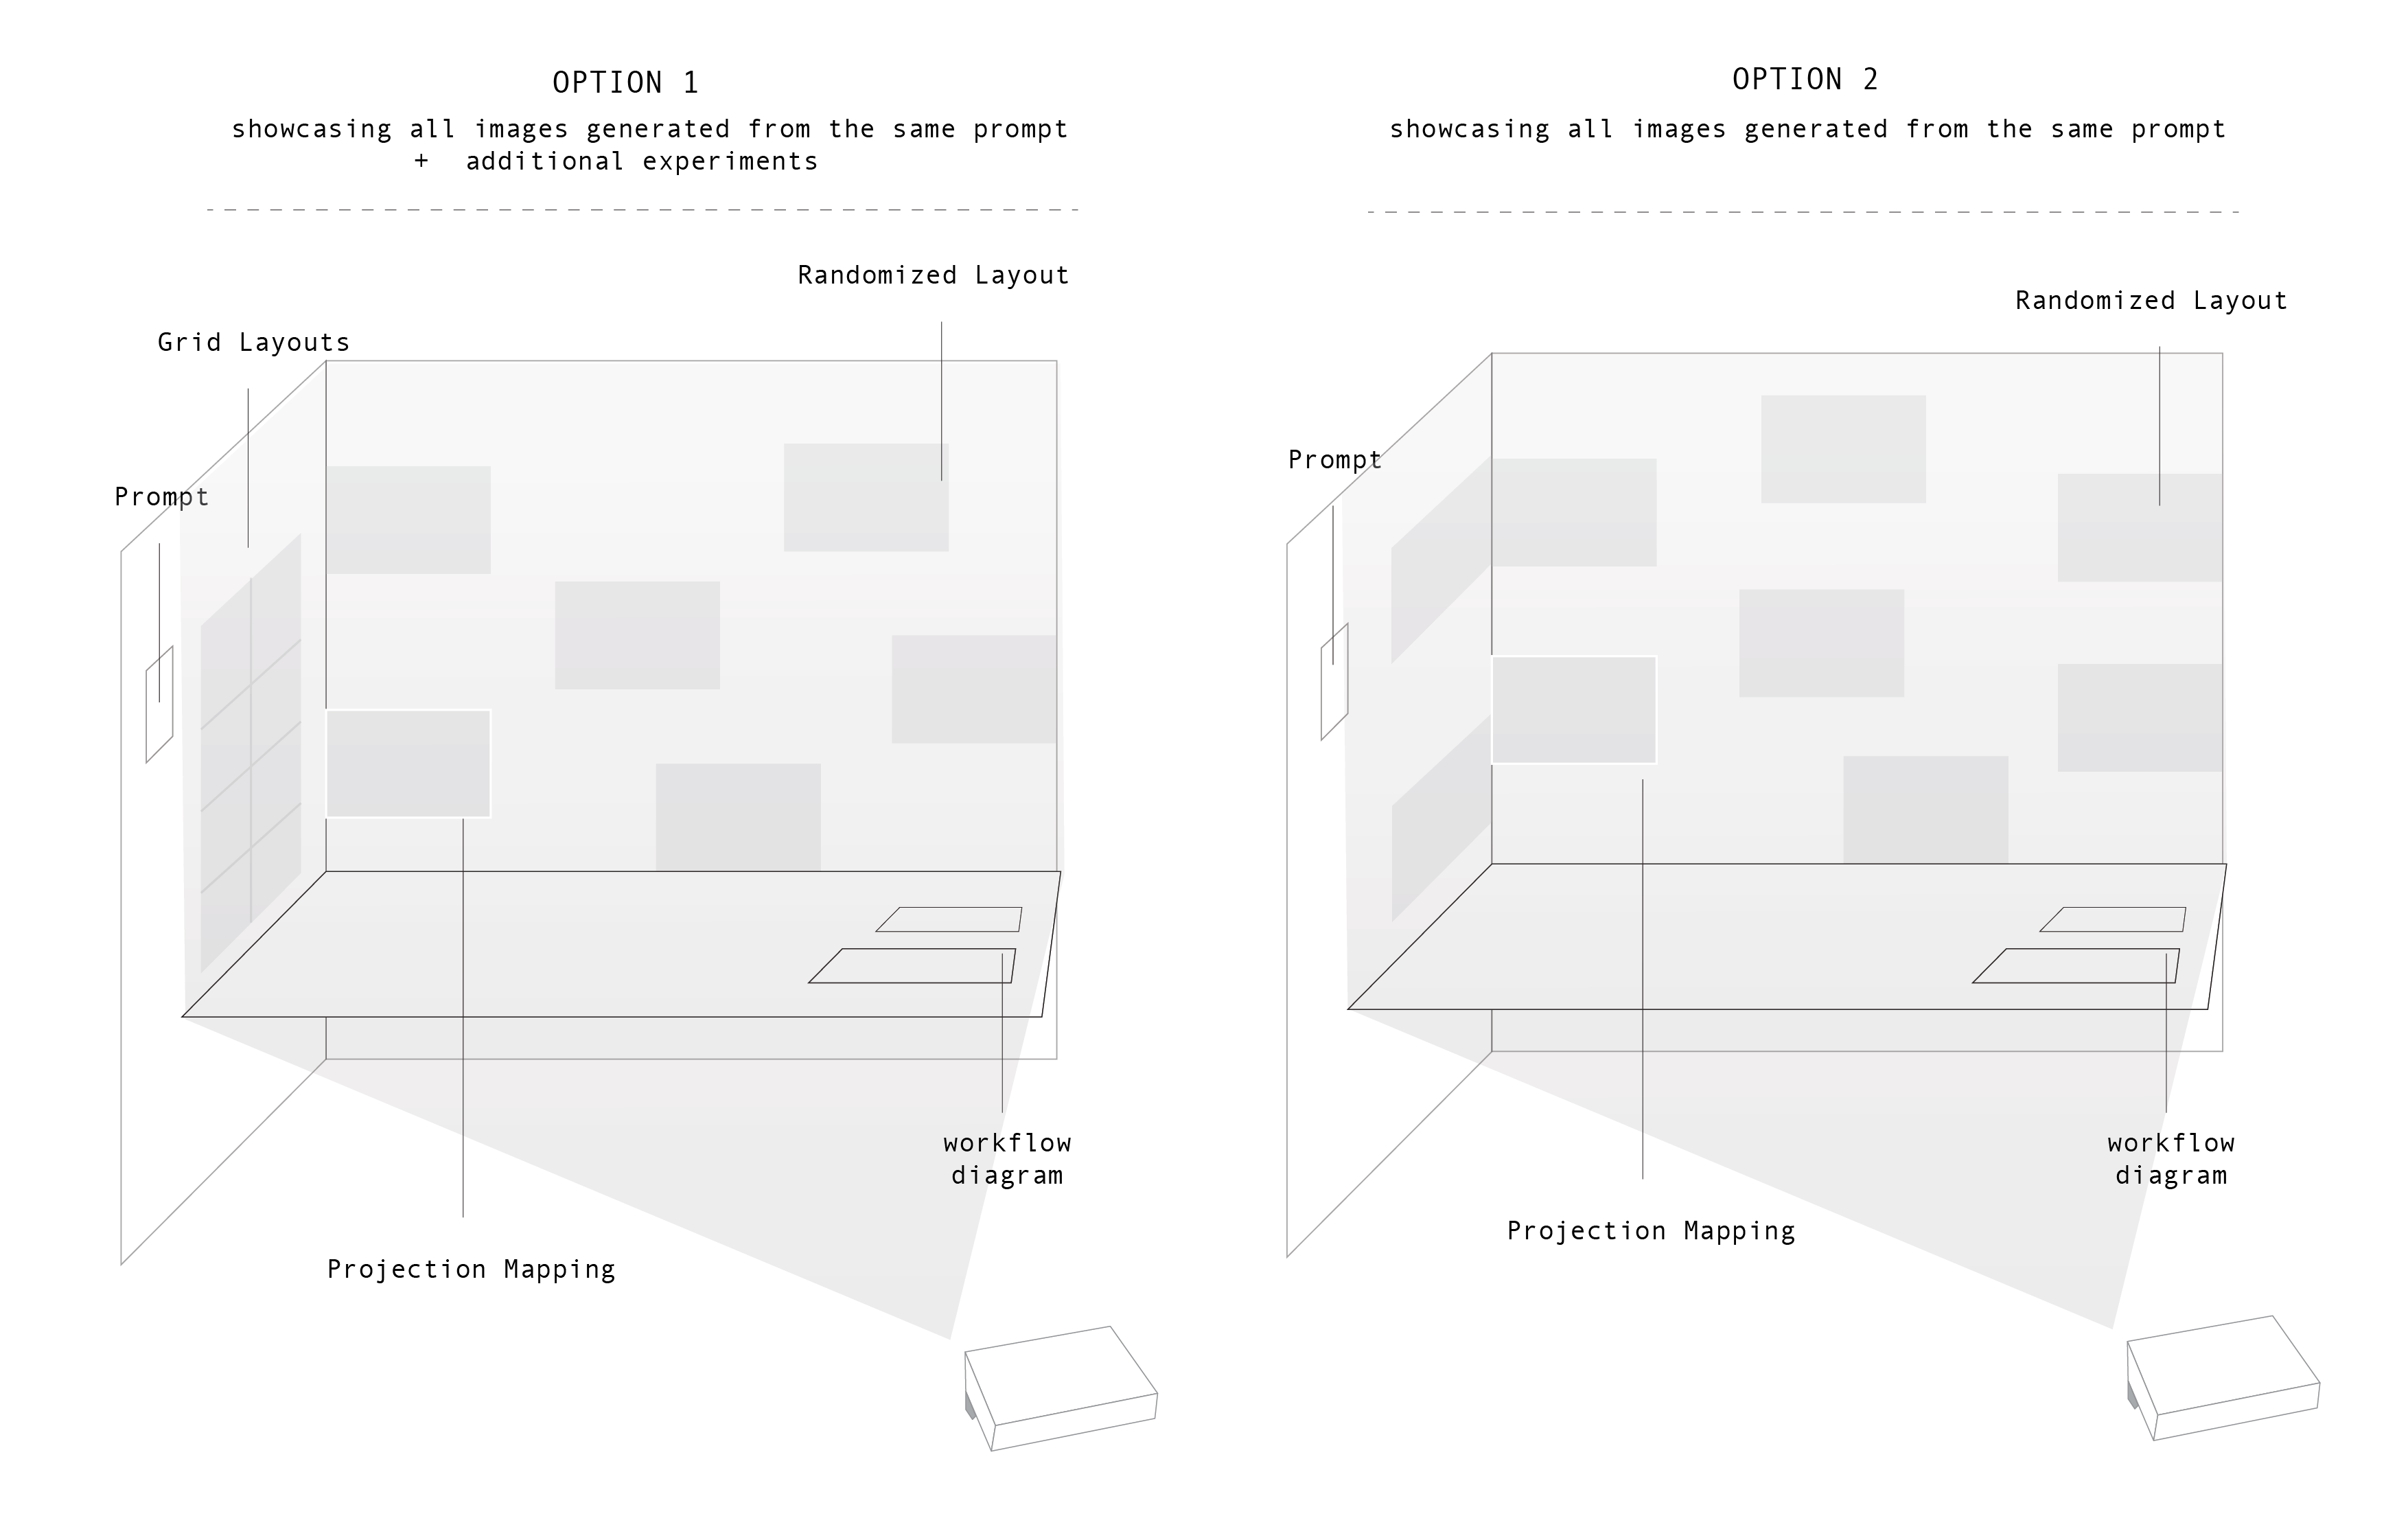
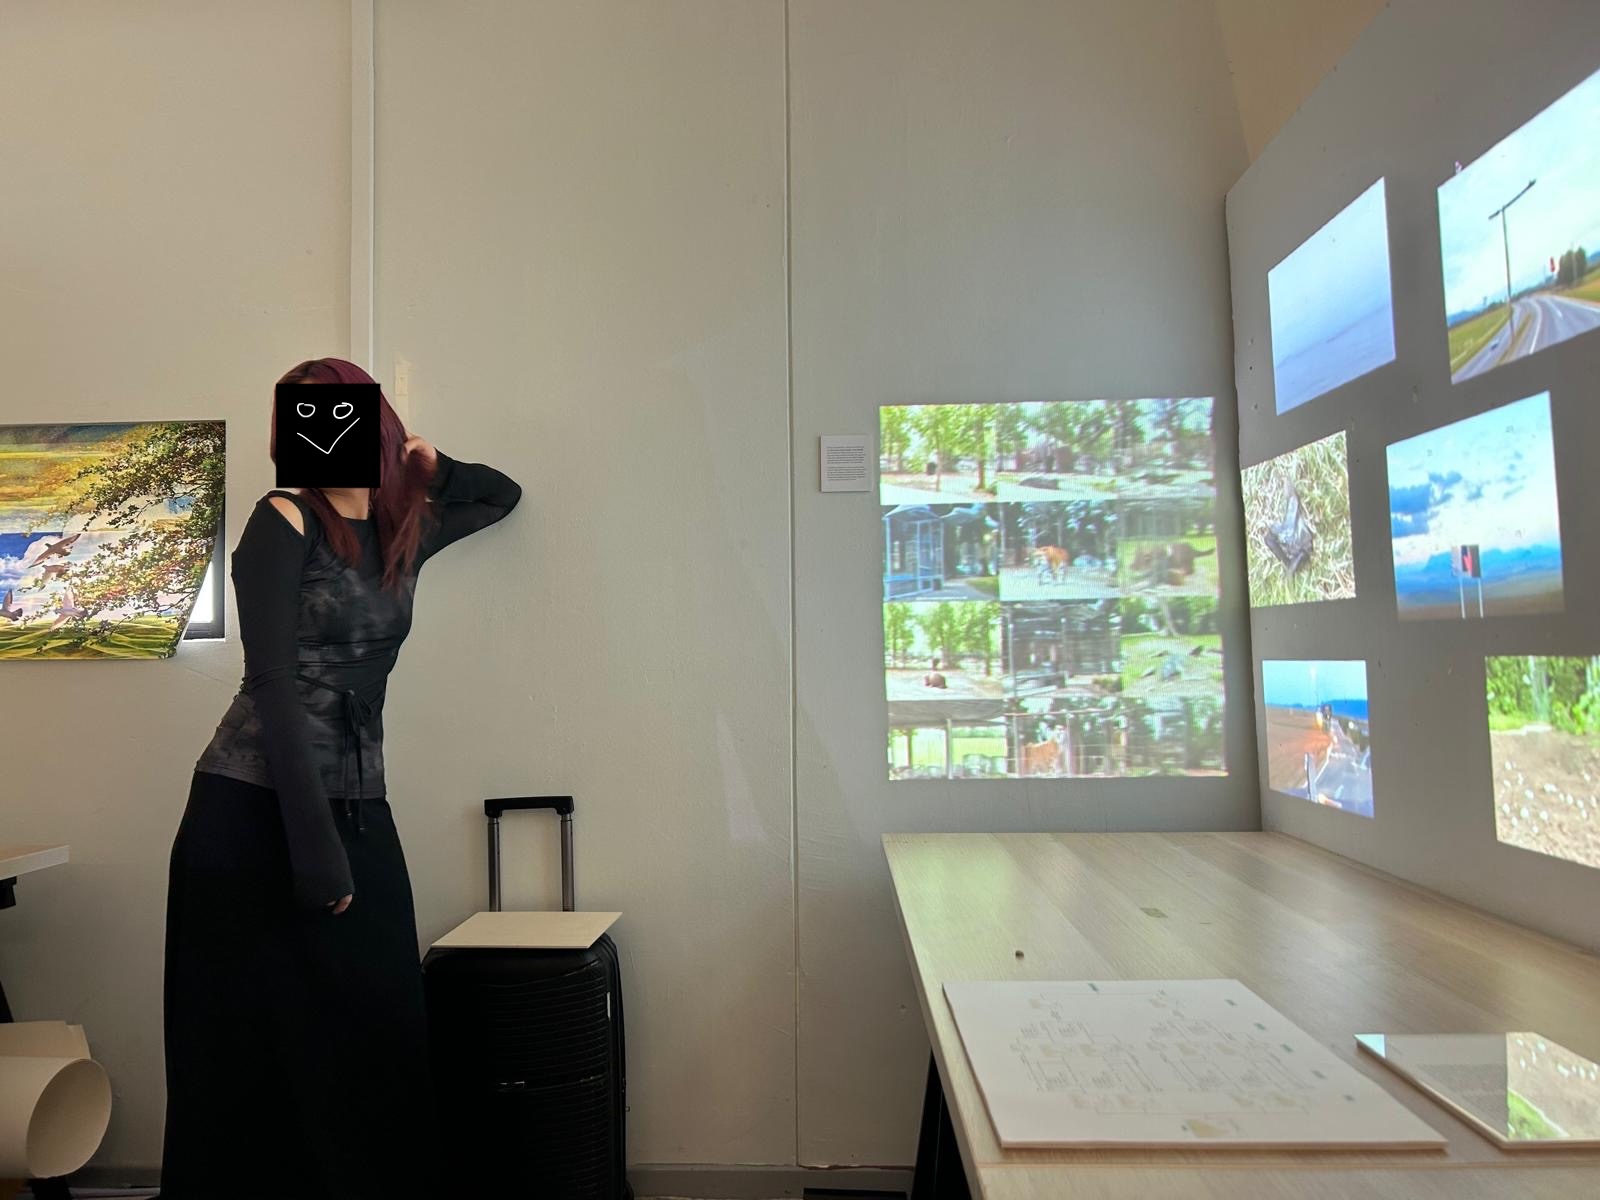
Just for this week’s progress checkup, I planned to use projection mapping as a way to showcase the visuals I have generated from my experiments.
I selected them based on what I found interesting, and created two different options: the left side could be the visuals that are more cohesive which comes from the same prompt, while the front side could be in a more flexible layout where I showcase the outputs that are interesting and inspired me to create more.
Hopefully, i can get the interactive system done by Open Studio. However, for this week’s table setup progress, I had to showcase what I have done up until now.
Table-Setup In-Progress
Projection Mapping
I made use of the two side walls that I have in my space, and use projection mapping to mapped out the visuals as I planned on the diagram above. I added the sound generated from the prompt as well to make it more lively. It didn’t take me that long to mapped them on the wall as I already had the sketch file in p5js for the projection mapping.
All I had to do was to create a script on how am I going to explain this to the people — the visuals and the processes behind the workflows that results to these outcomes. Now that I set them up like this, I wasn’t sure whether I should display the works from Semester 1.
Perhaps I should rethink about how am I going to design the visual identity of my space. It doesn’t have to be too much, but I would like to leave an impact to people, and I felt like I needed to pay attention to the way I design the description and print out the other outcomes.
Feedbacks & Insights
Point 1: Workflow Visuals
One insight I got from Zarer was that he found the questions I asked the model to be quite thoughtful and meaningful. To make the final outcomes more convincing, it would help to show the thinking and process behind those questions as well. Andreas also pointed out that the current diagram feels more technical, which I agree with. Simplifying it by removing unnecessary terms could make it easier for people to understand.
Point 2: Possible Interactions
Truth be told, presenting these videos as the main set-up wouldn't be enough to convey the thoughts behind my process. There should be a guidance, perhaps like a writings, or another visual medium that convey what it is about. Although the videos look nice, it would be hard for me to explain what these videos are about just by presenting solely this as the outcomes.
One suggestion I kept in mind was to incorporate some form of interactivity. For example, if I want people to engage with the flaws found in these generated contents, I could design an interaction where they can press buttons to zoom in and explore these flaws more closely.
I agree with the feedback that the current setup lacks visual clarity. The presentation of the outcomes still feels vague, and I need to find a way to make it easier for people to access and engage with the work, to truly enter my world. Whether that’s through a film documentation, or a publication, I need to create a more accessible and inviting entry point into the project.